Overview
The Reports section in EventPrime gives you a simple way to view and analyze your Event Bookings. You can track key stats like total sales, ticket count, and Booking trends using filters and a visual graph. It helps you stay informed about your Events‘ performance and Booking activity over time.
Steps to View Reports in EventPrime
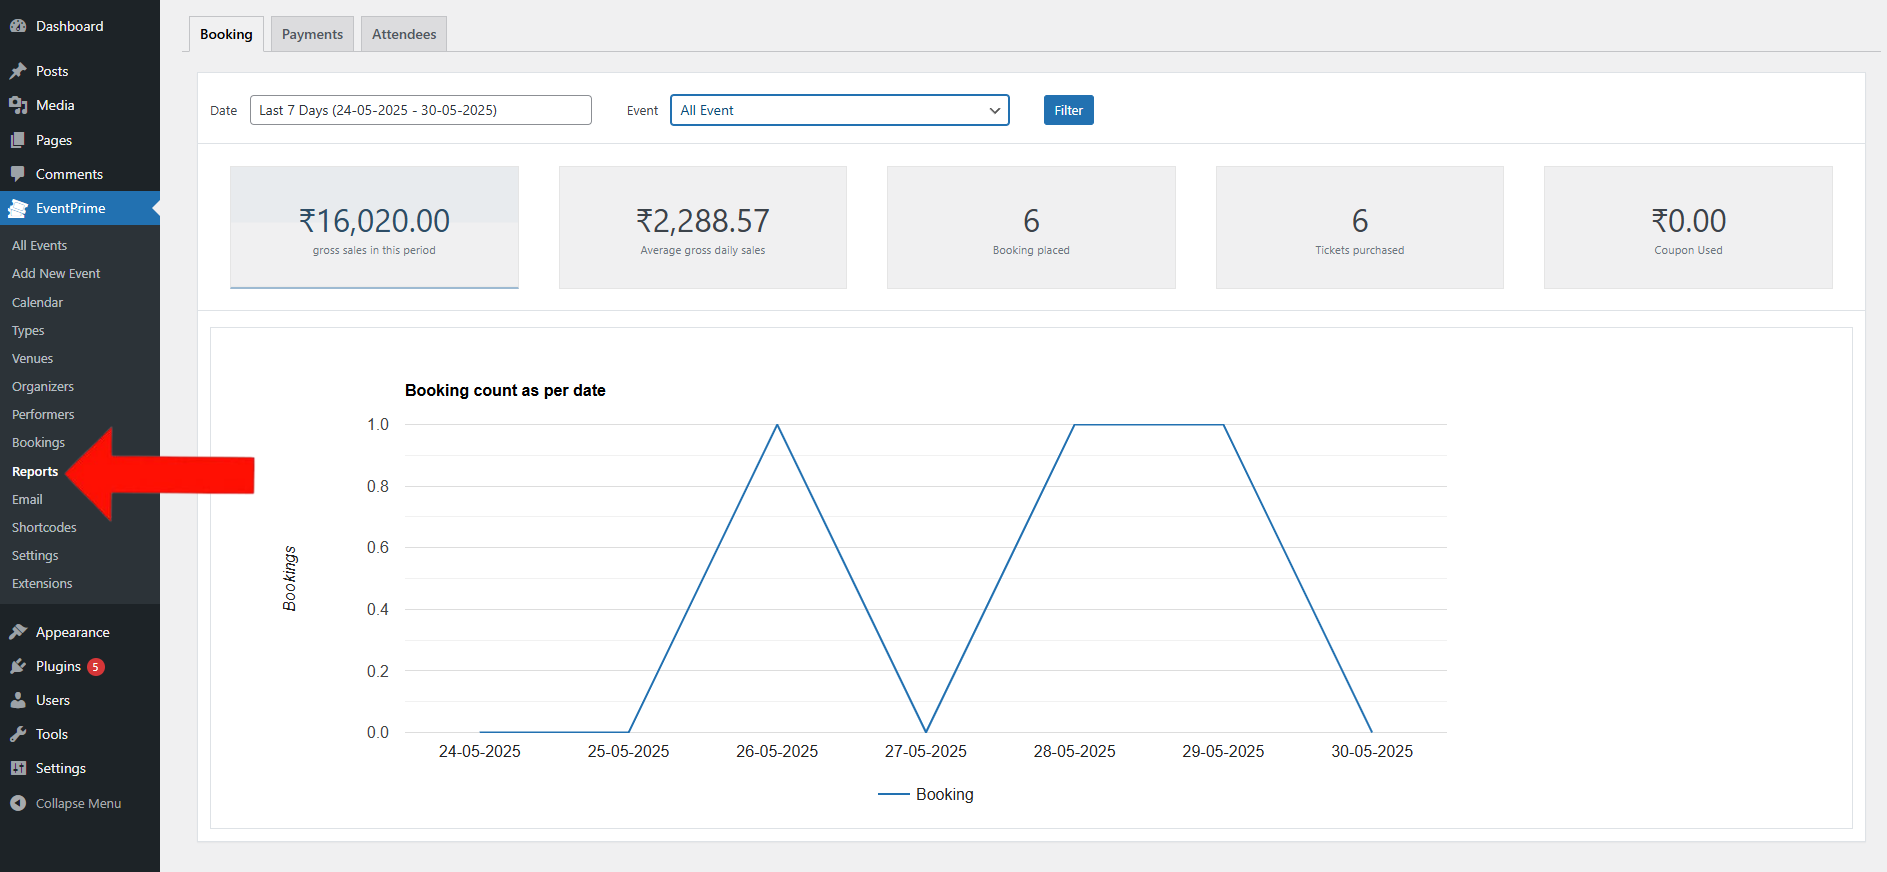
1. Navigate to the EventPrime menu, and select Reports submenu. This page shows an overview of your Event Bookings, including totals for Bookings, tickets sold, gross sales, average daily sales, and coupon usage. You’ll also see a graph that displays daily Booking activity based on your selected filters.
Use the available filters to refine your report:
- Date: Choose the date range from the available dropdown options Today, Yesterday, Last 7 Days, This Month, Last Month, or choose Custom Range to select custom Start Date and End Date.
- Event: Select an Event from the dropdown list to view its specific Reports.
After selecting the filters, click the Filter button to update the report view.

2. Below the graph, you’ll find a detailed table showing all completed Bookings that generated revenue.
Each entry includes important information about Booking such as the Booking ID, Event Name, Event Date, Booking Status, and the Payment Gateway used. This helps you quickly review and track the financial impact of each Event.

Conclusion
The Reports section in EventPrime helps you stay informed about your Event performance. With access to key Booking data and revenue details, you can make better decisions and plan your future Events more effectively.
Questions, Support & Custom Solutions
- Need more details or can't find what you're looking for? Let us know how we can help! Contact our support team here.
- Looking for a tailor-made solution to meet your specific needs? Our dedicated customization team is here to help! Use this link to share your requirements with us, and we'll collaborate with you to bring your vision to life.